Time Tracking with Todoist
Context
Yesterday afternoon Karri Saarinen asked if anyone had a good system for tracking how they spend their time.

After looking through ~50 replies, it looked like there was an opportunity. Half of the suggestions were automated solutions like RescueTime or Toggl. While these are low effort, they make it hard to add stuff post hoc and/or keep track of non-digital activities. They also aren't as customizable as people want. While there were fully customized solutions like Rahul's The Most Effective Way to Track Your Time, these often require a lot of manual effort to get the data into a useful format. Karri posted some screenshots of a concept where he could quickly add activities and also tag them as energy draining or energy gaining.

I was inspired by the idea so spent my Fri night trying to see if I could cook up my own workflow. My goals were to make it:
- Easy to add tasks
- Highly customizable
- Use existing tools
The Workflow
After playing around with TaskPaper files, Day One, and Alfred, I ended up deciding to use Todoist. Their API seemed easy to use, and I also like how you can quickly add items via a global shortcut and quickly add tags using keyboard shortcuts.
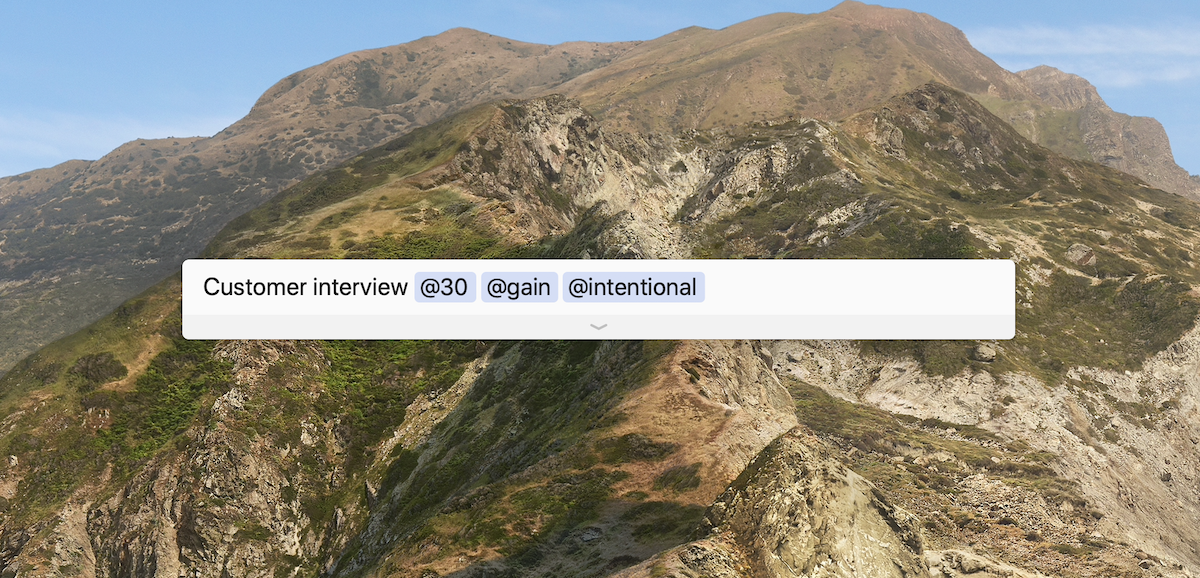
To add a task, you simply trigger Todoist's global shorcut and type in your activity. You can then add tags like how many minutes you spent doing the task, whether it was an energy @gain or @drain, and any other tags you think may be helpful later on.

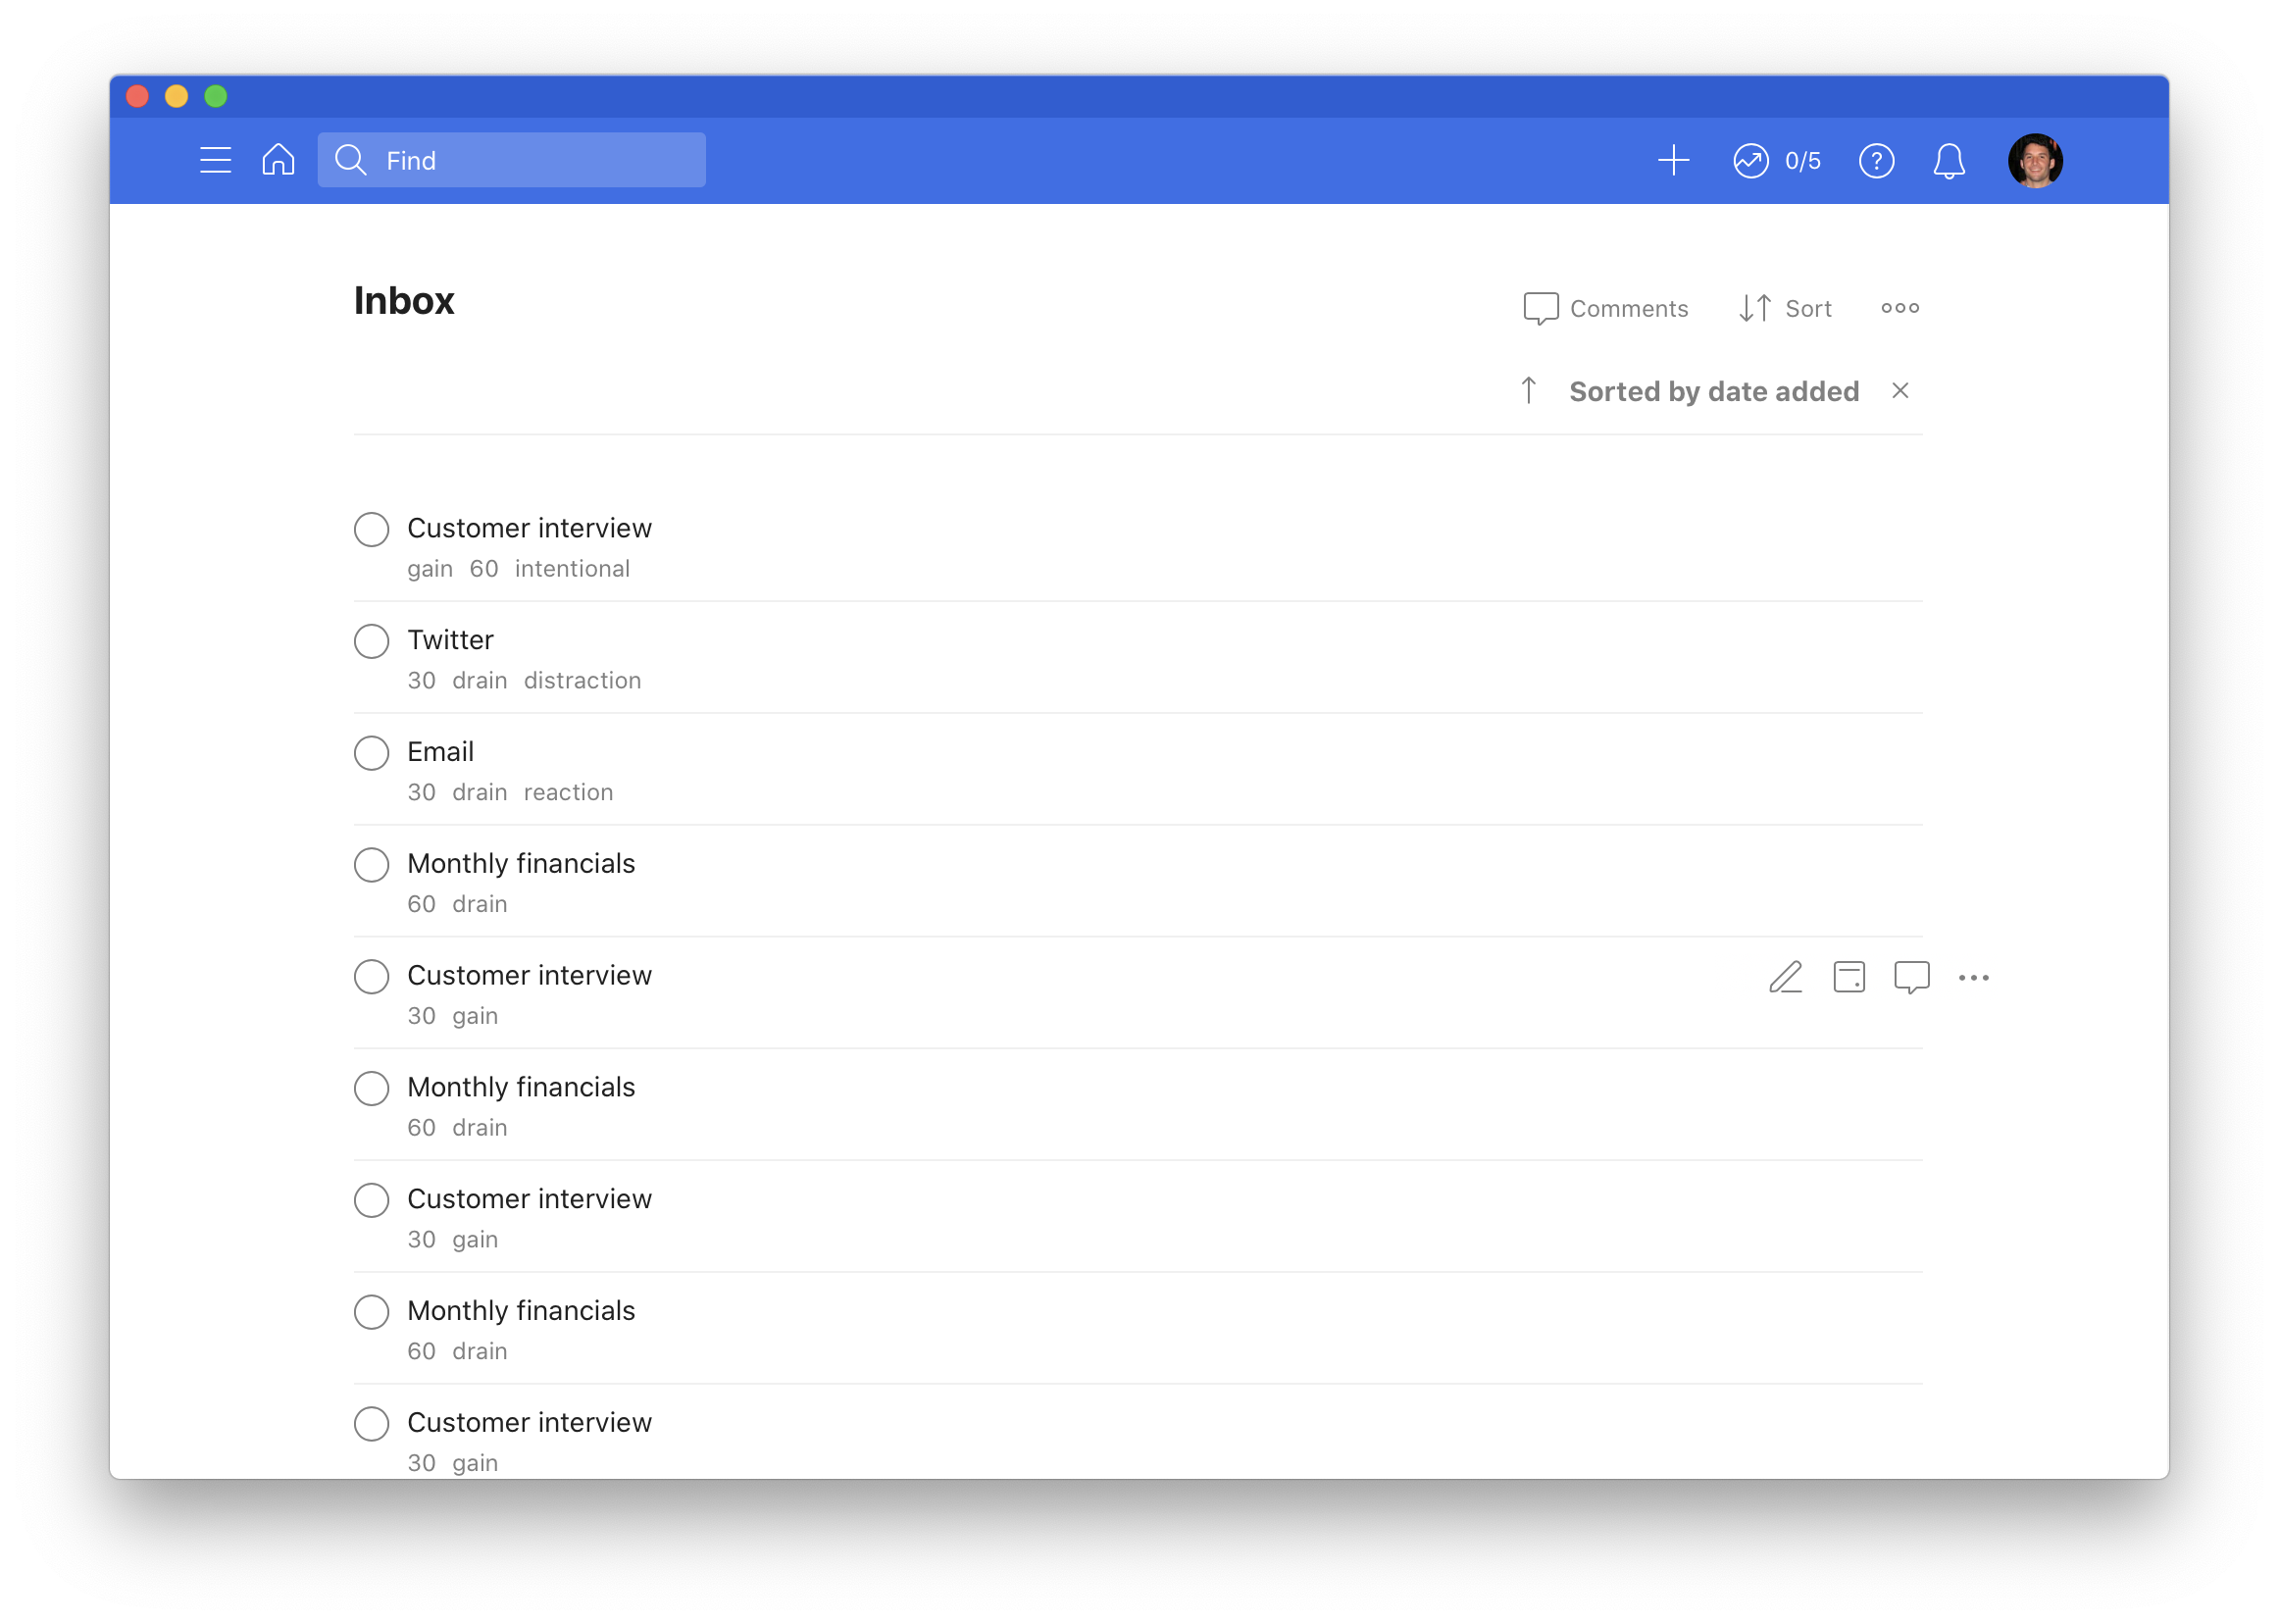
For the purposes of this workflow, I decided to leave the tasks in the Inbox. This reduces the need to add a Project to each item. However, if you are a regular Todoist user you will likely want to use a specific Project so that you can use your Inbox for non-time tracking items. You could either do this via a keyboard shortcut when you add activities or by manually moving all tasks to a specific project in batches. Here's my example Inbox:

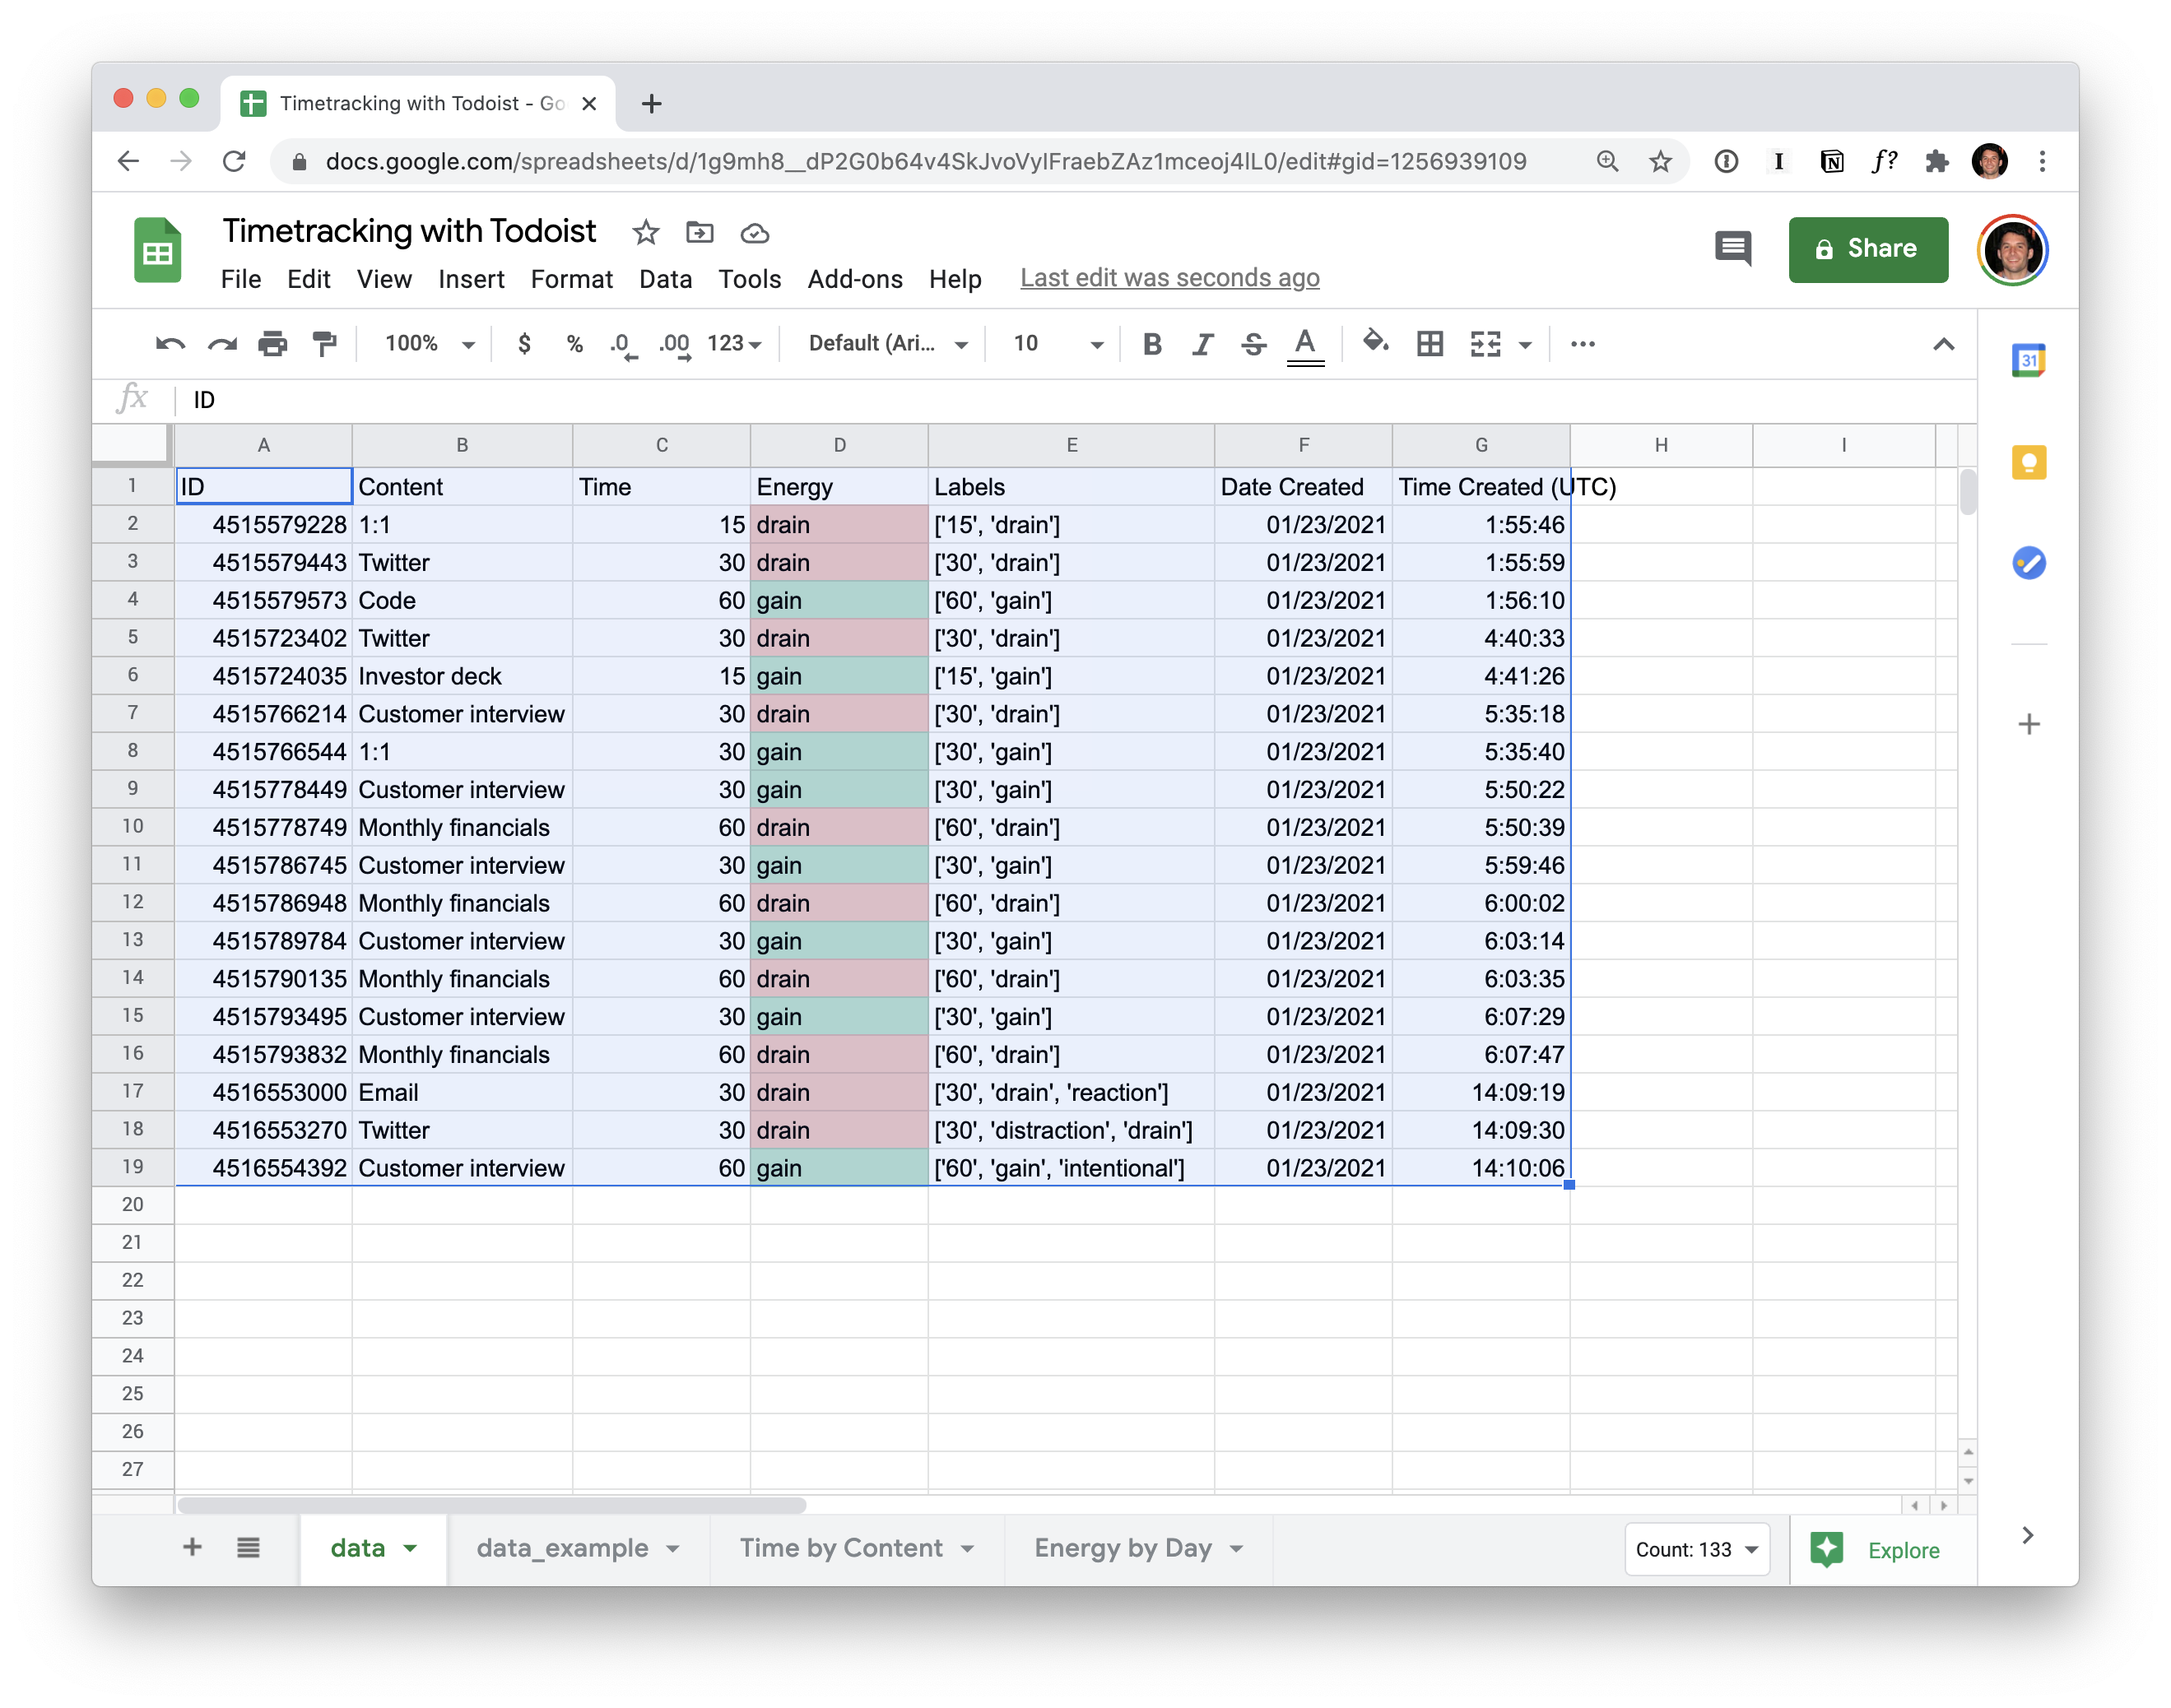
Now that the items are in Todoist, I created a script to export them into a specific CSV format that will make it easy to upload and analyze in Google Sheets. Once the script is run, you can upload the CSV file in a Google Sheet via "File > Import > Upload". Here's an example of what this could look like:

With the data in Sheets, you can slice, dice, and display the data to your heart's desire using pivot tables, charts, and whatever other Sheets trickery you know. Here's an example of a pivot table that shows an example of time spent by activity over the past week. Pivot tables make it easy to quickly change the time horizon via a dropdown menu. You can check out a demo of the workflow in action here.

Summary
It was a lot of fun bringing this idea to life. There is no better feeling (especially as a bad developer) than bringing to life something that was just an idea a couple hours ago. While there are probably better solutions out there, I think this solution strikes a good balance of being easy to use and highly customizable, a combination that seems rare based on all the replies. If you'd like to try it out you can find the script and more specific setup instructions on GitHub.